Keeping an hourly token ledger with Claude Code hooks
An append-only JSON Lines file with one line per transcript per hour, read by byte offset from four hook events, and a single-file page with inline SVG charts.
Blobber now keeps a ledger of what every coding session and every background worker used, hour by hour, and I have a page to read it on. A hook keeps the ledger up to date by itself. The page is one HTML file with tiles for the day, three charts by hour, and tables by task, by worker and by model. The hook is registered, but I hadn’t seen it fire in a live session when this merged.
Why did I want it by the hour?
I already had a report that reads the assistant’s transcripts, and I ran it by hand earlier the same day. Workers were 74% of the spend. A request cost half what it did the day before, since the two guard hooks went in: 28k weighted tokens per request, down from 56k, and the median peak context dropped from 492k to 258k. But tasks now take several workers each, because a worker hands over to a fresh one when its context gets too big.
I wanted to watch that by the hour and not have to ask for a report every time. So I asked for a hook and a skill that write the consumption to a file for every task and worker, and a page to see it on.
Writing one line per transcript per hour
Claude Code writes one JSON Lines transcript per session and one per worker, and it deletes old ones. So the ledger is a separate file and not a view over the transcripts. Once a transcript is gone, the ledger is the only record.
Each ledger line is one transcript in one hour. Here’s a real one with the ids shortened:
{"key":"d8f001ec/subagents/agent-a21bfcbc.jsonl","utc":"2026-10-10T23","hour":"2026-10-10T16",
 "kind":"worker","id":"a21bfcbc","session":"d8f001ec","label":"Floors and lifts importer",
 "task":"slice-floors","agent_type":"general-purpose","model":"claude-opus-5-5",
 "models":{"claude-opus-5-5":23},"requests":23,"calls":43,"fresh":48,"write_1h":0,
 "write_5m":239225,"read":3705334,"out":2636,"weighted":682792.65,"peak":262008,
 "first":1791673630,"last":1791674252,"handoff":true,"written":1791684177}
requests is calls to the model and calls is tool calls. The token fields are fresh input, input written to the one-hour and five-minute caches, input read from the cache, and output. peak is the largest context of one request in that hour. handoff means the worker ended on a handover report.
weighted puts the token kinds on one scale, where 1 is a fresh input token. It’s the same table the older report uses:
WEIGHT = {"fresh": 1.0, "write_1h": 2.0, "write_5m": 1.25, "read": 0.1, "out": 5.0}
For that line it’s 48 + 239,225 x 1.25 + 3,705,334 x 0.1 + 2,636 x 5 = 682,792.65. That’s a ratio for comparing hours and workers. It isn’t money, because the project has no prices in it.
Claude Code writes a message to the transcript once per content block, with its usage so far each time, so the same message id shows up several times. The reader remembers the last 40 message ids per transcript and what each one added. When an id comes around again, it subtracts the old numbers and adds the new ones, so a request is counted once with its final usage.
How does it read only what’s new?
A state file keeps a byte offset for each one, plus its size and modified time from the last read. If the size and time haven’t changed, the file isn’t even opened. Otherwise the reader seeks to the offset and reads 4 MB at a time:
with open(path, "rb") as f:
    f.seek(entry["offset"])
    while entry["offset"] < size:
        block = f.read(CHUNK)                 # CHUNK = 4 << 20
        cut = block.rfind(b"\n")
        ...
        take(entry, block[:cut].split(b"\n"), changed)   # adds to the hours, notes which changed
        entry["offset"] += cut + 1
        f.seek(entry["offset"])
It takes everything up to the last newline in the block and moves the offset just past it. Anything after that newline is a line still being written, so it waits for the next run. If the file is shorter than the offset, it was replaced, and the reader starts again from 0.
Most of a transcript’s bytes are tool results. Each line is tested as raw bytes first, and it’s only parsed as JSON if it has "assistant" in it, or a session title, or it’s the worker’s brief. Most lines never get parsed.
Why is the ledger append-only?
A ledger line is never an amount to add. It’s that hour’s whole total so far. Every time a transcript grows, the hours it touched get appended again as fresh lines, and loading the ledger keeps the last line for each transcript and hour:
true = {}
for text in f:
    line = json.loads(text)
    true[(line["key"], line["utc"])] = line
So reading a transcript twice counts nothing twice. If the state file is lost, everything is read again from byte 0 and appended again, and the load gives exactly what it gave before. A test does that and compares. A run that gets interrupted leaves at worst a line that the next run replaces.
Replaced lines pile up, so a manual run rewrites the file with only the true lines once it’s more than 1.5 times the true count plus 50. The hook never does that. It only appends.
Tying a worker to a task
A transcript in a subagents folder is a worker, and its parent session is the name of the folder above that. Its label comes from the .meta.json next to it, which has the description it was launched with.
The task is the branch it was told to work on. Every brief I send has a line saying which worktree the worker has to stay in, so the brief is searched for that line, and if it’s missing, for the first worktree path the brief names:
WHERE = re.compile(r"Work only in[^\n]{0,200}?Worktrees[\\/]+Blobber[\\/]+([A-Za-z0-9_.-]+)")
CWD   = re.compile(r"Worktrees[\\/]+Blobber[\\/]+([A-Za-z0-9_.-]+)")
If both fail, the working folder on later rows is tried. 56 of the 64 workers on record resolve to a task. The other 8 were briefed without a worktree, and the page lists them under “(no branch named)”.
Running it from four hook events
The hook is a 62-line script registered on four events:
| Event | Why |
|---|---|
Stop | The main session finished a turn. Its transcript is read first, then every other one that has grown, so running workers are brought up to date too. |
SubagentStop | A worker finished. Its last requests and its handover flag go in right away. |
SessionStart | Reads whatever the last session left unread because it was closed or killed. |
SessionEnd | Catches a session’s last turn if it ended without a Stop. |
I didn’t put it on tool calls, because that would run thousands of times a day. Workers get read whenever the main session finishes a turn, which is often enough for an hourly page.
The hook gives up after 2.5 seconds, between chunks, and the offsets mean the next event carries on from there. It takes a lock by creating a file with O_CREAT | O_EXCL. If another run already has the lock, the hook does nothing, because that run is doing the work. A lock older than 120 seconds is treated as dead and removed. Every error goes to a log file and the hook always exits 0, so it can’t fail a turn.
Building the page as one file
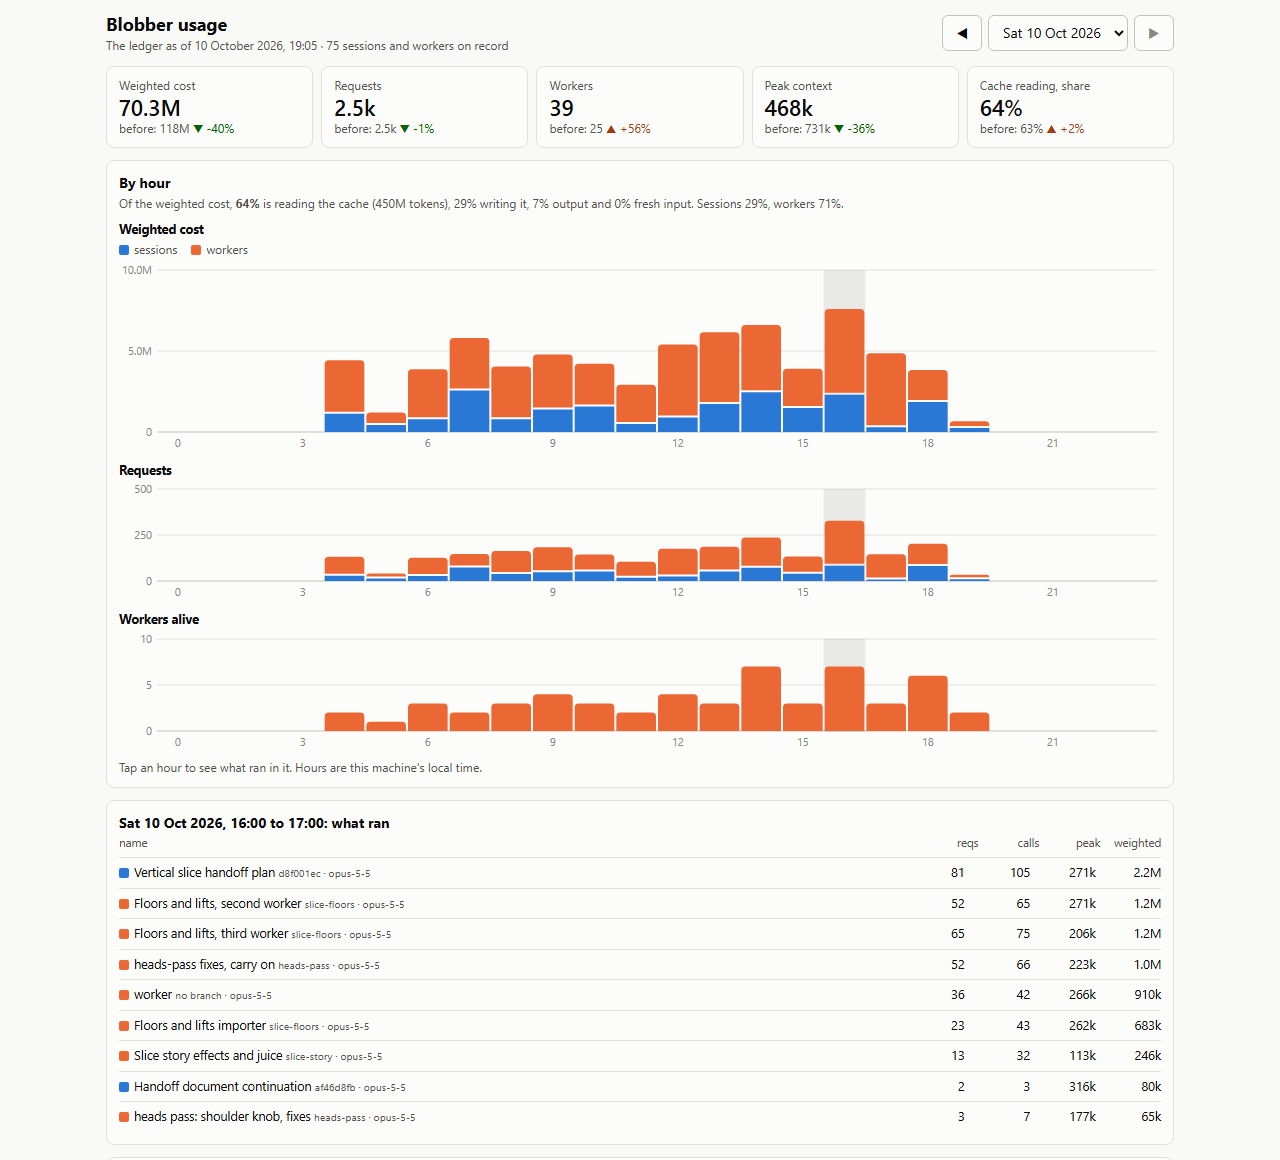
The page is a 21 KB template with one marker, /*DATA*/, that gets replaced with the ledger packed as JSON. There’s no server, no network request and no library. I wanted one file so it can be sent to my phone and opened there. The data is a list of transcripts and a list of rows, where each row is an array that starts with an index into the transcript list. With 201 ledger lines the built page was 48 KB.
Everything else is worked out in the browser. A view is one day or the last 7 days, and the view before it is totaled the same way for each tile’s “before” figure. The hour with the largest weighted cost is picked to start with.
The charts are inline SVG built as a string by one function. It measures its box, so the same code draws at 380 px and at 1280 px. The y axis tops out at the largest hour rounded up to 1, 2, 2.5, 5 or 10 times a power of ten. Each hour is a stacked bar made of two <path> elements, sessions below and workers above. A tap finds the hour from the pointer’s x position alone, so my finger doesn’t have to land on a bar.
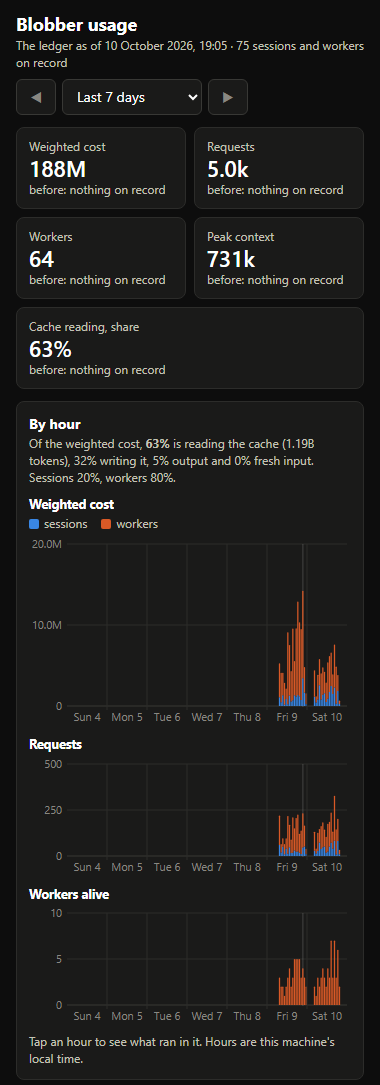
Colors are CSS variables that are defined again inside @media (prefers-color-scheme: dark), and the SVG fills use var(--workers), so the charts follow the phone’s theme without any script.
What did the first numbers say?
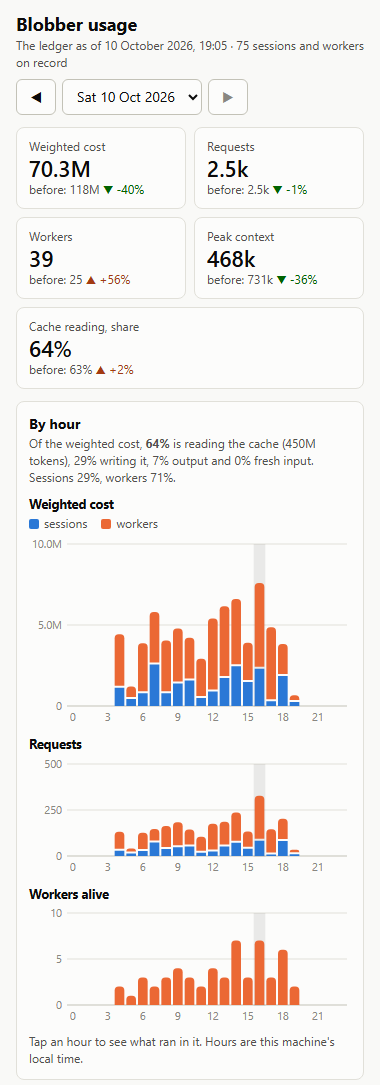
The backfill read 75 transcripts (11 sessions and 64 workers) into 152 ledger lines in about 2 seconds. Run by hand, the hook takes 0.15 to 0.19 seconds. The ledger agrees exactly with the older report on 73 of the 75 transcripts, and the two that differ were still running. All 14 checks in its test pass.
10 October came to about 70M weighted tokens against 118M on 9 October, with 39 workers against 25.
What doesn’t it show?
- I haven’t seen the hook fire in a live session yet. It works when run by hand, but I don’t know that
SubagentStopandSessionEndfire for a background worker here. - There’s no money on the page, only weighted tokens.
- Nothing before 9 October is on disk.
- A worker whose brief names no branch has no task.
- A worker’s minutes run from its first request to its last, so time spent waiting on a build is in there.
- The hook doesn’t rebuild the page. For now a session sends me the file when I ask, and nothing is published.